In tIn the context of lean production, spaghetti diagrams are proven means. The spaghetti map injects transparency into the complexity of work processes, not least with regard to the distances covered by production and logistics personnel in the course of their work. All too frequently, historically evolved structures result in unfavorable arrangements for material staging and consequently in waste due to unnecessary transport and empty travel. Fast visualization of such situations, even with simple tools, is often the catalyst required to initiate improvements (e. g. PDCA, Six Sigma). For this reason, the spaghetti diagram is a very popular contribution to optimization projects, especially in industrial assembly.
How to create a spaghetti diagram
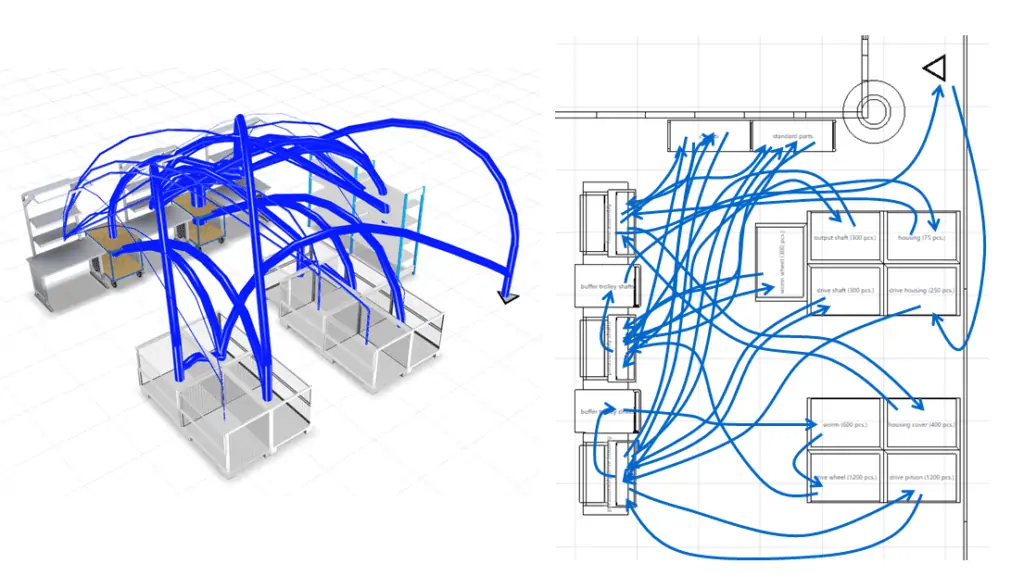
In accordance with the lean approach, most of the diagrams are simply drawn by hand. To this end, the movements of a worker are followed chronologically by adding lines to a two-dimensional layout until the whole work cycle or the takt under investigation has been completed.
This procedure can soon result in a rather untidy clutter of lines in the case of more extensive processes, which also explains the name “spaghetti diagram”.
The evaluation of a spaghetti diagram will provide answers to important optimization questions:
- Is there waste to be identified in the work flow?
- Can we design the worker’s process flow as straight lines?
- What is the total length of all movements required for an assembly cycle?
- Which motions could be saved by rearranging the layout?
Advantages and disadvantages of a spaghetti diagram
The principal advantage of a spaghetti diagram is at the same time its greatest disadvantage: They can be The principal advantage of this kind of diagram is at the same time its greatest disadvantage: They can be created at any time using pen and paper and thus require no special tools or software. This lean procedure, however, makes evaluation difficult, because the laboriously acquired data cannot be used digitally. In other words, for example, each movement must be measured out again subsequently. There is similarly no possibility to derive data directly for a material flow analysis as information is simply lacking on whether the recorded movements were realized with or without materials transport. Accordingly, spaghetti models frequently require further editing and enhancement.
Software support?
It is thus a logical idea to produce spaghetti charts with the aid of software. Widely used office or graphics applications, such as PowerPoint, Excel, or Visio, promise fast results. In this scenario, however, the actual analysis must still be performed in advance, whether by video or using pen and paper, as the aforementioned tools are not designed for the recording of travel distances directly on the shop floor. The strengths of such software packages lie rather in the facilities for editing and presentation; they are thus not suitable to compensate the disadvantages of the lean pen-and-paper method.
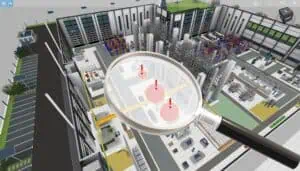
Some companies even go as far as to record the distances traveled in production automatically by way of trackers. For the movements of forklifts in the stores, for example, this appears to be a clever solution at first sight. It quickly becomes clear, however, that the technical outlay is considerable and that it is probably expedient to rely on the know-how of a specialist provider for this task. In addition, it is no simple matter to transform such automatically acquired data into the vivid graphic form which is characteristic of a spaghetti chart.
Involve the employees!
When using standard software, further utilization of the information visualized in a spaghetti diagram is generally neither effective nor efficient. This also explains why it achieves the greatest benefits in KAIZEN workshops, where the diagram is analyzed immediately by the participants. In this case, additional relevant information is still fresh in the mind and can be taken into account directly in ideas for improvements.
Where the German Works Constitution Act applies, there is a legal aspect to be considered: In logistics, manufacturing and assembly settings, spaghetti diagrams often focus on the movements of individual employees. The use of technical systems, including video devices and software, to record worker movements may well impact their rights of co-determination (§ 87(1), no. 6, BetrVG – German Works Constitution Act). As soon as there is any hint that an employee’s behavior or performance is subject to monitoring, it is imperative to involve the works council. This aspect is avoided where the spaghetti diagrams are drawn manually.
This notwithstanding, it is always beneficial to uphold transparency by explaining the purpose of any spaghetti analyses to the employees concerned.
Conclusion
Mapping spaghetti diagrams is simple and offers a starting point for numerous avenues of improvement to identify waste in production. Even so, it calls for either immediate evaluation or relatively elaborates further treatment in order to draw useful effects from an analysis. This is because the information content of the spaghetti diagram itself is rather minor compared to the additional input for analysis. The diagram shows only the paths of different means of transport in the widest sense. For material flow analyses, not to mention intensity analyses serving systematic layout optimization, the transport information must be enhanced with further pertinent details, e.g.
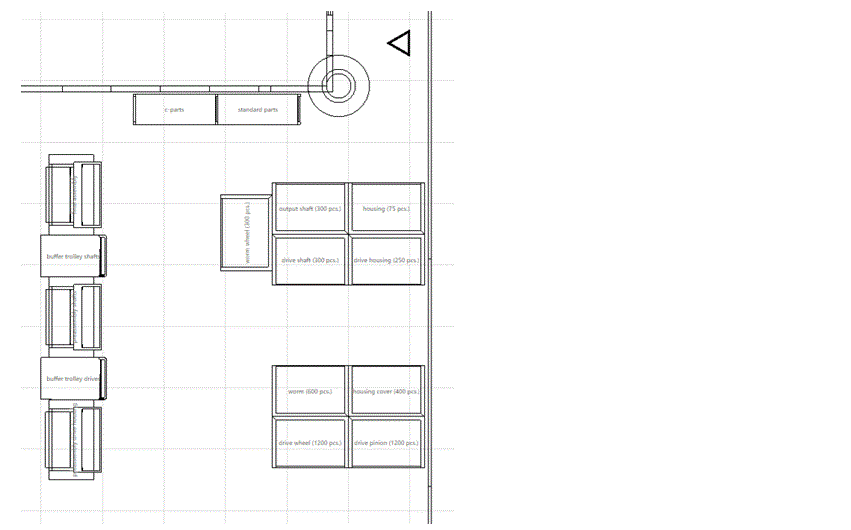
- exact distances (which requires a scaled representation of the layout);
- materials transported (type of container, filling level, contents, empty travel).
Office software is often used to provide this enhancement, but is wholly unsuitable for the task. Facilities for scaled representations and specific evaluation functions, in particular, are missing. This deficiency is also indicated by the lack of suitable templates.
If knowledge relating to spaghetti diagrams is used to create a visTABLE® layout, however, relevant information can be gleaned amazingly quickly and implemented in a digital planning environment.
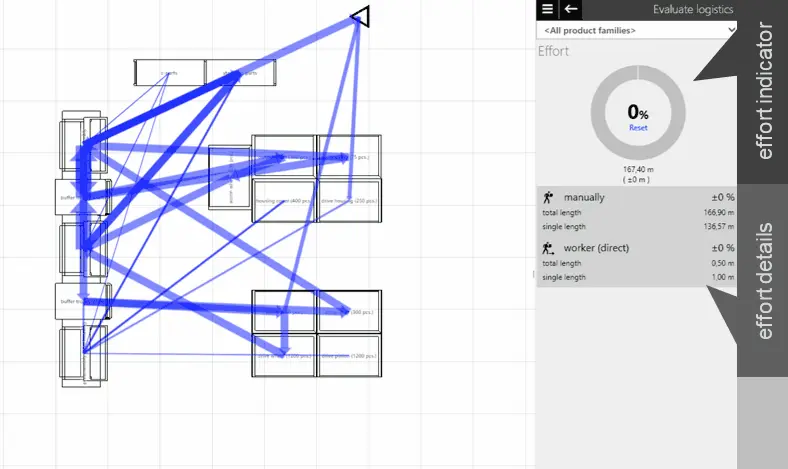
To show how a spaghetti diagram can be used for assembly planning in visTABLE®, we have prepared a short video.