How do I permanently manage my 3D factory model correctly with 3D-Reporting?
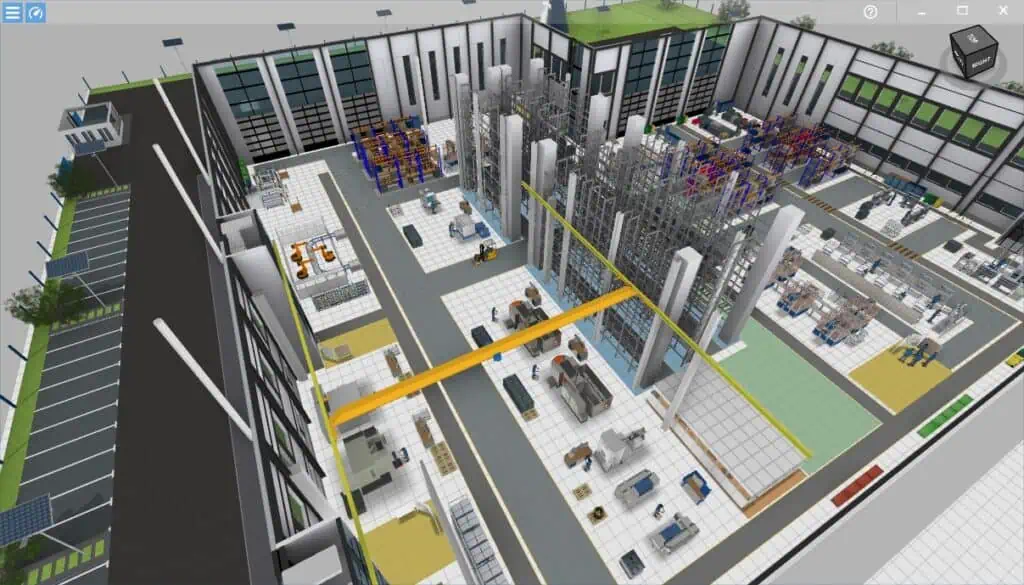
visTABLE® enables you to build 3D layouts in the shortest possible time, using the included model library as well as imported CAD data. The latter, however, can quickly and unnecessarily bloat the factory layout, because the amount of data is often a hundred times greater than a supplied standard model. But how a factory model is set up in visTABLE® with standard models also has a significant influence on manageability. Especially when you work in a team and involve employees using less powerful notebooks and desktop PCs, it is worthwhile to take a look at the current state of your 3D layout.
The ObjectManager already gives an indication of model complexity when importing CAD data with corresponding traffic light colors. But what can I do if my 3D layout is already in place and navigation in the 3D view hardly seems possible anymore, and loading times feel like half an hour?
Note in advance: In the blog article, the term “triangles” is used throughout. This also stands for “faces” or “polygons” from which 3D models in visTABLE® are constructed.
“U Key” – Make complex CAD data visible
visTABLE® has an integrated 3D report function that helps you quickly track down overly complex 3D models. The most convenient way to do this is via the hamburger menu in the 3D view.
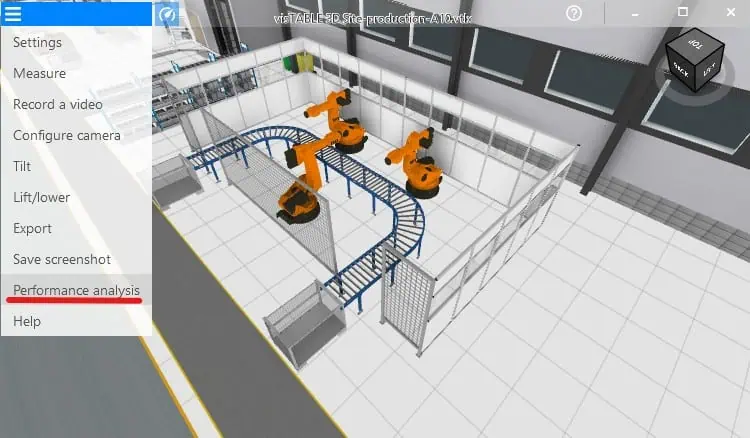
After calling it up, a blue window appears with a simplified evaluation of the top 3 3D models, which together account for the largest share of the data volume in the layout.
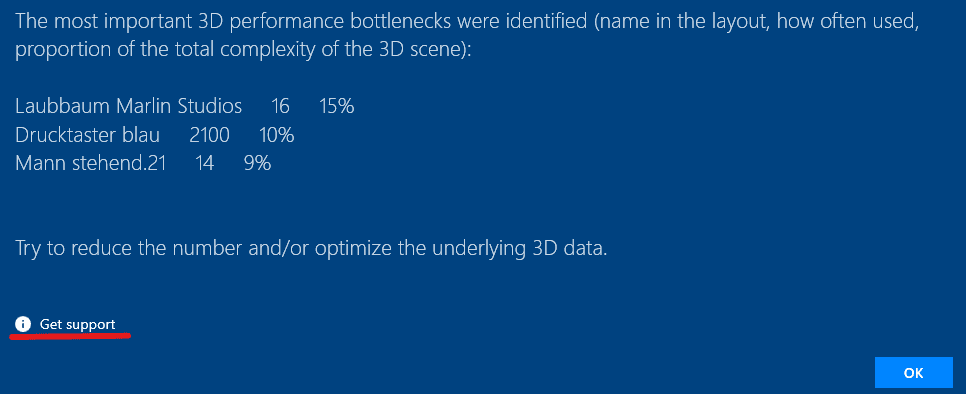
Via the link “Get support” you will be directed to a website with tips for optimizing performance. If you confirm this message with OK, an Excel table with data for the performance analysis should open after a short while. Alternatively, the performance analysis can also be generated and accessed as follows:
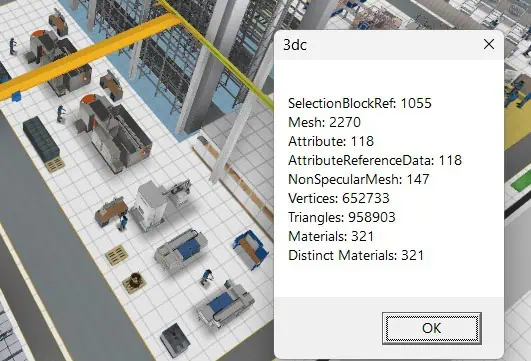
Step 1 – In the 3D view, press the “U key” until the following window appears. Confirm the message with “OK”.
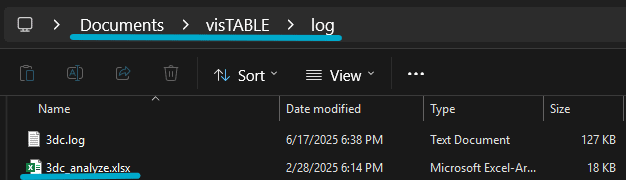
Step 2 – Navigate in Windows Explorer to the following folder c:\Users”username”\Documents\visTABLE\log. You should see the Excel file 3dc_analyze.xlsx. In this file, a 3D model analysis for all layout objects has been saved. It is best to copy the file to another storage location so that it is not accidentally overwritten.
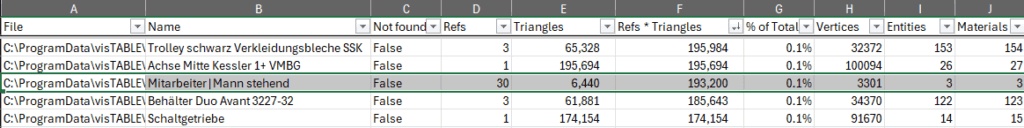
Step 3 – Open 3dc_analyze.xlsx in Excel to view the results. For evaluating model complexity, columns D to G are of interest. The following explanation uses row 4 “Man standing”:
| Column | Description (Example “Man standing”) |
| D – References | Number of placed instances of a 3D model, 14x “Man standing” |
| E – Triangles | Triangles Number of triangles or polygons the 3D model consists of, responsible for the complexity, 6,440 triangles |
| F – References*Triangles | Product of D and F, the complexity arising from frequent use of a model, 90,160 triangles |
| G – % of total | Percentage share of layout complexity due to the use of the 3D model, also taking into account the number of instances. |
| Other columns: | |
| A – File | File path to the used 3D file in Wavefront OBJ format |
| B – Name | Name of the layout object in visTABLE®. If different names are used in visTABLE® for the same 3D model, they are listed in succession separated by “|” |
Based on this information, in the next step, complex 3D models in the layout can now be identified.
ABC Analysis of Complexity Drivers in the 3D Layout
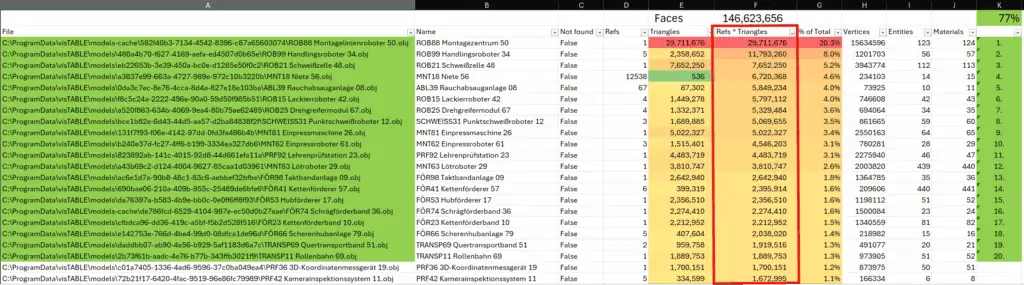
For prioritization, the data in 3dc_analyze.xlsx was sorted by column F, the sum inserted as the total value, and the column marked with a heatmap scale. It then looks like this.
Tip:
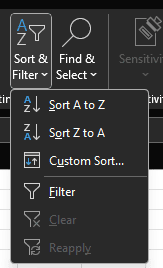
A prioritization can be achieved using the filter function in Excel. Select all columns and apply the “Filter” function.
Now the data can be filtered by columns D, E, and F, or also in two stages.
In this case, according to the Pareto principle, a top 20 of 3D models emerged that should be examined more closely. In the example shown, 225 unique 3D models are used in the layout, of which 20 objects account for 77% of the total amount of data. This means that only about 10% of the 3D models used generate almost 80% of the total data volume. In such an imbalance, you should definitely take a closer look.
Two Basic Perspectives on Complexity and Data Volume
1 – Individual models with large amounts of data (Column E “Triangles”)
Especially CAD datasets that come from equipment suppliers are usually about 100 times too large. The reasons for model complexity have already been described in a blog article on handling CAD data.
Typical situations:
- Low frequency and very large amount of data: CAD product data as STEP files with file sizes from often 50 MB to 1 GB from machine tools, worktable configurations, robots, shelves from online configurators, transport devices like forklifts or AGVs, and also BIM architectural models. Such 3D models quite often contain several million triangles.
How do I recognize if models are too big?
Models with more than 50,000 triangles are often already too large. However, this also depends significantly on the dimensions of the model. A machine tool with a base area of 10m² would just be acceptable with 5,000 triangles per m². The traffic light in the ObjectManager then displays yellow. A container of 400x300mm with a base area of 0.12m² and the same polygon count would, however, mean more than 400,000 triangles per m², resulting in a red light in the ObjectManager. Ideally, up to about 2,000 triangles per m².

In our example, a single layout object generates about 20% of the total data volume of the factory layout. With just under 30 million faces, it is a very complex 3D model. The identifier “assembly center” suggests that an entire area has been mapped here. You can check the data density (see also the section further down) based on the placement area in the layout.
2 – Frequent Use of a Model (Column D “References,” F “References*Triangles”)
Less complex models too can become a problem in the layout if they are used hundreds or thousands of times in the layout. Therefore, column D indicates the number of instances of a 3D model in the layout. Column F is then interesting, because this indicates the total amount of data (number times triangles).
Typical situations:
- Very high frequency/small amount of data: For example, 100 containers are arranged on a shelf, and in the containers, 100 small parts as CAD models with a size of 0.1 MB each are placed to visualize the filling. This results in 10,000 new planning objects (references) and a volume of 1 GB of data. In our example, it is 12,538 3D models which produce a data volume of 6.7 million faces and thus account for just under 5% of the total data volume of the layout.

The identifier suggests a small part in a container. The number of faces alone appears small. But if this “rivet” is only 20x50x20mm in size, it is a very complex 3D model, and, in total, due to the very large number, a huge amount of data is generated.
Tip:
Generally avoid placing many small parts in the layout. Also use the option to enter meta-data, for example using a user-defined attribute that provides information about the type of material. However, if 3D visualization is absolutely necessary, have optimized 3D models provided by a service provider or at least weld the individual objects in the ObjectManager together so that your layout always remains slim.
- Medium frequency/medium data volume: A 30 MB CAD model of a rather inconspicuous extraction system is used a total of 100 times at numerous workstations in the layout. This results in a data volume of 1 GB. In our example, there are 67 instances that bring about 6 million faces into the layout and thus account for 4% of the total layout.

Tip:
The 3D model of the extraction system should be optimized before use. Temporarily use a placeholder model that can be constructed from 3D primitives from the model library. Replace this placeholder model at a later time with the desired model using the “Replace” function.
How do I recognize that a 3D model is used too frequently?
If you find a three- or four-digit number or higher for references of a 3D model in the layout, you should take action.
A third factor that reduces performance when using 3D models
Besides the number of triangles and references in a layout, there is another technical aspect that greatly influences so-called “draw calls.” These are the commands sent by the CPU to the graphics card (GPU). The fewer commands are sent to the GPU, the better your layout will run in 3D. How well a model works with the graphics card is shown in columns I and J.
| Column | Description |
| I – Objects | Number of individual meshes in a 3D model |
| J – Materials | Number of materials in a 3D model |
High double-digit or even triple-digit values in either column indicate a poorly optimized 3D model, which can significantly affect 3D performance, as the number of draw calls increases proportionally with the number of objects. Frequently, these are 3D models that also have a high number of triangles. In that case, you already have the model in view. But there are also exceptions where the amount of data or number of triangles does not attract much attention at first, but a second look reveals a high number of objects and materials. The following example:

The model is not in the top 20 and has an unusually high number of individual objects and materials. Since the number of materials is higher than the number of objects, this model cannot be directly optimized either. For comparison, standard models in visTABLE® have up to a maximum of 5 objects or materials, which means that these models are 100 to 600 times better optimized compared to this model, as far as draw calls are concerned.
Tip:
When importing into visTABLE®’s ObjectManager, objects with the same materials are automatically merged. The 3D model is thus automatically optimized as far as different materials are present in the model.
It is also possible to merge materials in models by other methods, as described in the next section.
How can I solve the problem of too many draw calls or objects?
Option 1 – Service provider:
Ask a service provider to help you with model optimization. plavis GmbH offers 3D modeling services for this task. There are also technical possibilities via software to simplify CAD data.
Option 2 – Remesher
So-called remeshers automatically create a kind of new “skin” over the original 3D model. This often reduces the draw calls to 1. Read more about this in the article on automatic simplification of 3D models.
How do I find the overly complex 3D models in my layout?
If you have filtered your top 10, top 20, or 50, you can easily find the models concerned using the search function in visTABLE®.

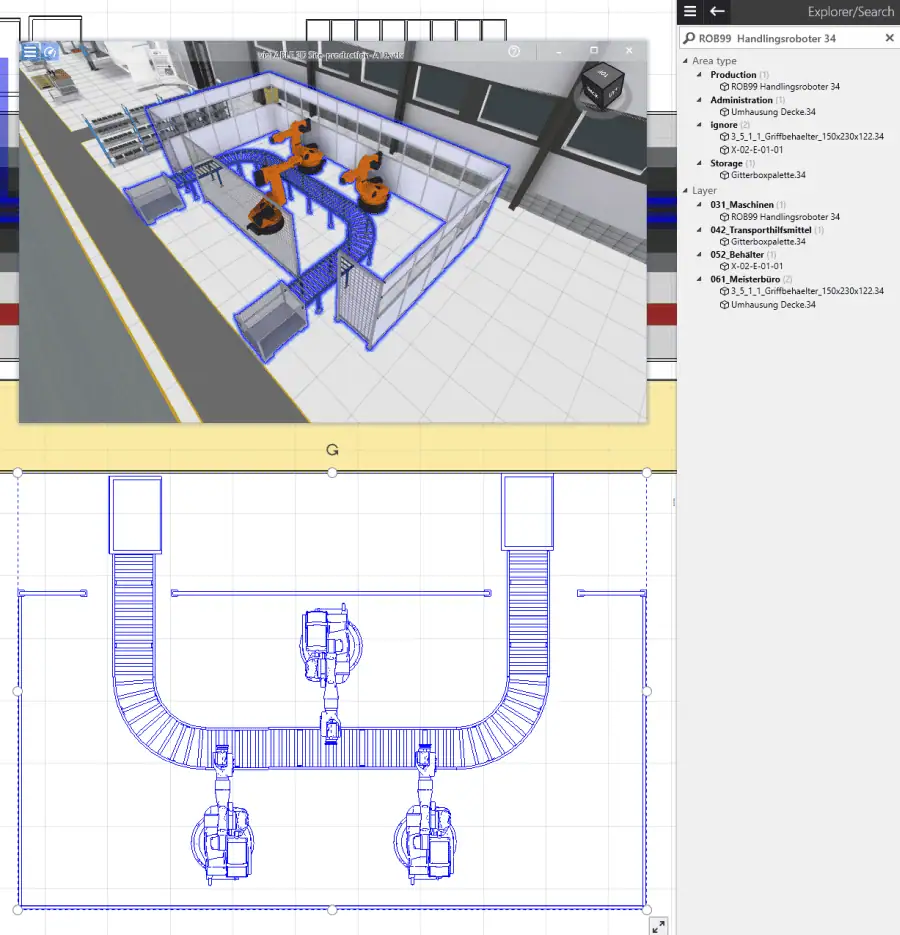
Search for the layout object name given in column B. If several are given there separated by “|”, just select and copy one name to the clipboard and paste it into the search field. In the following example, “ROB99 Handling robot 34”, the second-placed model in terms of model complexity, was searched for. You can select the found models either individually with CTRL + left mouse button or an entire block with SHIFT + left mouse button. The selected models are then marked in 2D and 3D. In the 3D view, you can select a view at the top right via the view cube with the left mouse button. In this case, one edge of the cube was selected to get an oblique view from above onto the complex models.
Now you know exactly which 3D models are involved and can take appropriate measures to address the problem.
Data Density in the Layout – What the “U” Key Can’t Do
The 3D report function gives you the amount of data and frequency for individual 3D models in the layout and thus hints about 3D models that may restrict loading time, operability, and display of the layout. But it does not provide information about excessive data density that can arise from the arrangement of 3D models in the layout.
What does data density mean? It refers to the area data per m² or also per m³. This is known for an individual 3D model. The more triangles per m² or m³, the higher the data density or packing density. But the data density in the layout can increase significantly by arranging many layout objects in a small space. This happens, for example, through intensive use of the bulk function (“Pulk-Funktion”), which also allows duplication in height.
Practical Example – Small Parts in Containers
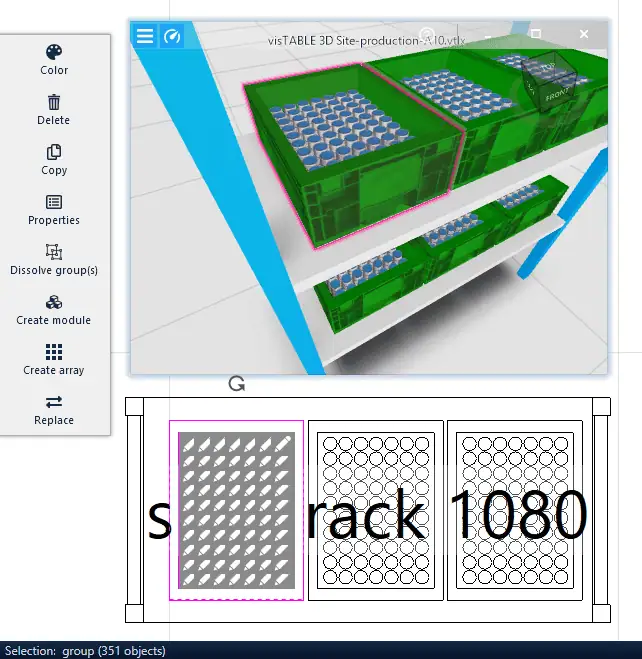
Let’s take the already mentioned example of small parts in containers. In each container of 400x300mm with a base area of 0.12m², 350 parts of a pushbutton are stacked, and a module consisting of all objects is created. The shelf has 4 levels with three slots each and just over 0.5m² of storage space, on which then 12 containers with 4,200 small parts would stand. The following image shows the arrangement in the visTABLE® layout.
Each of these 4,200 pushbuttons consists of 48 triangles. This results in 201,600 triangles on just 0.5m². The data density far exceeds the recommended limits.
An extreme example, which you should definitely not imitate. The high number of individual layout objects can already lead to delays in input. Welding the containers with parts would improve 3D performance, but due to the high data volume per container of almost 17,000 triangles, frequent use of this model in shelves would also quickly lead to performance drops and long loading times. In this case, it would be better to create an optimized 3D model consisting of only about 30 triangles. This would reduce the data volume by more than a factor of 500!
Tip:
Basically, you should always ensure that you use only as many layout objects as necessary and weld modules. The more objects you use in a layout, the more likely it is that interaction with the layout will be delayed. You can ensure that your work and that of your team is not unnecessarily impaired by hierarchical layout structuring.
Conclusion
Always keep an eye on the complexity of your factory layout with the 3D report function and ideally work according to clearly defined rules when dealing with CAD data or 3D models in general; even if this means a bit more effort, it pays off in the long term.
You can also prevent complex CAD data by holding your equipment suppliers accountable and communicating your requirements via a specification sheet, and sensitizing employees internally to model complexity so that you always remain operational and enjoy working with your 3D layout. If you use visTABLE®VR, this issue should be given particularly high priority, as the requirements for real-time capability of VR models are even higher than in the normal 3D view.