When it comes to material flow analyses, many people immediately think of Sankey charts or factory layouts with material flow arrows. Such kinds of representations give a good overview as to where and in which intensity the material flows. However, often the question arises where it is most effectively to start optimizing the material flows. We would therefore like to present a tool that focusses on material flows that produce especially high efforts in transportation: The so-called distance intensity chart (DID).

What is a distance intensity chart?
Representations of material flow analyses in the form of a distance intensity chart are especially popular in conjunction with actual analyses of grown factory layouts. The principle is very simple: You draw a chart showing the intensity and the distance of transportation. Each point in the chart corresponds to a material flow between the two locations in the factory (source and sink). Specify the intensity of the material flow on one axis and the transport distance on the other one. Mark the resulting point of intersection by way of a point in the coordinate system. Thus, each material flow is assigned one point in the chart.
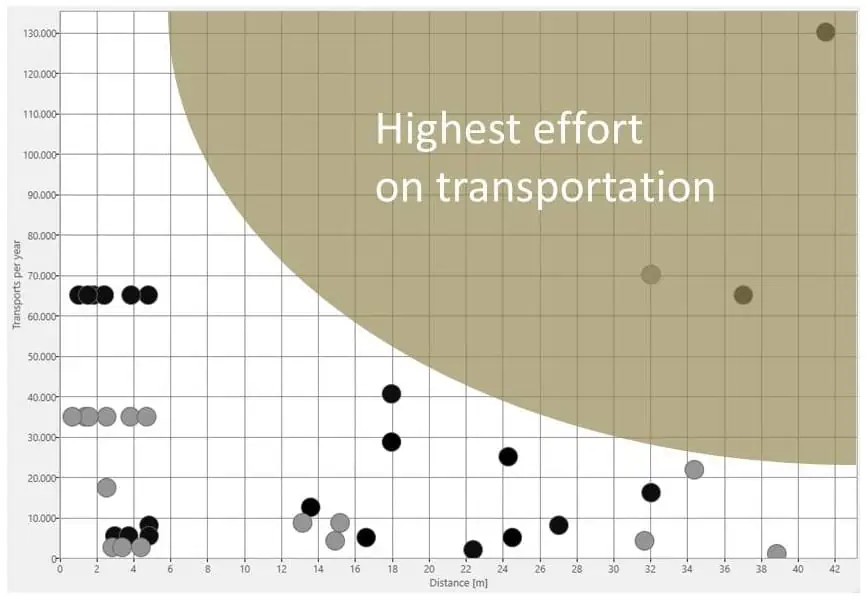
A distance intensity chart can be interpreted very simply: Material flows with high intensities and long routes should be avoided. Such flows are represented by way of points in the top right corner of the chart. If such points can be found, there is demand for action. If, however, all points lie close to the axis, high intensities are already realized over a short distance, and lower intensities can possibly result in longer distances which can be tolerated.
Which key parameters are contained in the distance intensity chart?
The two dimensions under consideration are:
- Material flow intensity, and the
- Distance between a material flow source and its sink.
The product of the two parameters is the area that is described by the two axes and the point of intersection formed by the intensity and distance. This area represents the transport effort, mostly expressed in km/a. It can easily be shown, for example, that high intensities in the transport effort can be compensated by short distances.
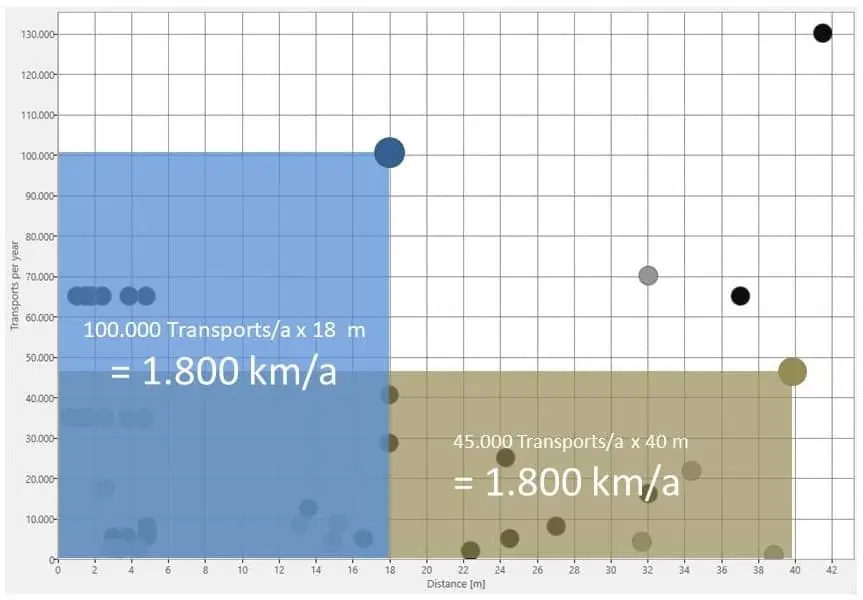
Especially in the communication in conjunction with planning projects, it is expedient to represent such compensation effects because the persons involved often focus on large transport distances they monitor in their own area and perceive them as a problem. The distance, however, reflects only one dimension of transport effort. Indeed, it can easily be recognized and measured, but that’s only half the story. It is much more important to devote attention to the transport intensity.
What does transport intensity mean in the material flow analysis?
The term ‘intensity’ in general is commonly understood as strength with a certain effect or degree. If the light intensity, for example, increases, it gets brighter. In physics, intensity specifies the degree of an energy flow per time and area. Consequently, the most important factor is reference of a parameter to a period of time. This also applies to material flow technology and logistics; there, typically the
- Numbers of transports (number of forklift transports, for example),
- Transport volumes (in m³, for example) or
- Weights to be transported (in t, for example)
are mapped to the reference periods. Periods of one year are common in factory planning. It is thus possible to compensate seasonal variations in the transport intensities to a large degree, resulting in a mean intensity. Working with mean values is expedient primarily in factory layout planning because a factory layout must be developed with sustainability. Efforts in transportation with their appropriate extreme values must therefore not be crucial when deciding for or against a layout, but instead it should be possible, as a rule, to access all systems and storage areas with minimum efforts in transportation.
The influence of the means of transport on the transport intensity
Which degree of intensity applies depends on the extent of knowledge regarding the logistic system and the planning task. It is expedient in this context to differ between degrees of intensity with and without reference to a transport means.
- Mass flows and volume flow rates are not referenced to transport means. They map transport volumes per period and – figuratively speaking – reflect the pure energetic efforts if multiplied with the distance to cover. It can easily be explained that, for example, significantly more transport energy must be used for transporting a ton of material over a distance of one kilometer than for transporting a ton of material over only 10 m.
- Transport flows measured by the number of transports are referenced to transport means. If they are referenced to a means of transport, a different picture would result, compared to the aforementioned example of a ton of material: You will probably also perceive the aforementioned difference in the efforts in meters; if you will, however, also include different means of transport in your consideration, the picture becomes distorted. If a ton of material is transported by way of a forklift, the one kilometer can be mapped by way of one transport; the 10 m, too. As a result, you will get transport efforts of 1,000 m or 10 m. But if you use a transport dolly for the 10 m instead of a forklift, significantly more travels are to be performed by the transport dolly to be able to transport the ton. For example, if the transport dolly can carry a load of 50 kg, 20 transports are required. Consequently, with a distance of 10 m, a transport effort of 200 m results. If a forklift is used, the distance would be 10 m.
How is the procedure?
For material flow analyses of the current state, the intensities are calculated from tracking transport means, for example. The transport routes are measured in the layout. For planning tasks, the transport intensities can be calculated if the following information is available:
- Weights or volumes of the products to be transported, or
- Number of products in conjunction with packing instructions.
Now, determine the demand in products to be transported per year and use this figure to calculate the required transport intensity. Use the transport means reference to additionally determine the transport batch size to be able to determine the required number of transports.
Example for the determination of a material flow point in the D-I chart
If you must transport e.g. 1,000 subassemblies per year from the storage to a production supply area (PSA), the following is to be determined if reference to a transport means is provided:
- How many subassemblies does a container suited for transport contain on average?
4, for example - How many containers are moved on average by the transport means per travel?
5, for example - A transport batch size of 4 x 5 = 20 products results. In other words: 1,000 / 20 = 50 transports must be realized to be able to transport 1,000 subassemblies per year. Thus, a transport intensity of 50 transports per year results in the material flow analysis.
If 50 m are to be covered between storage and production supply area, a transport effort of 2,500 m results. This material flow produces a point in the intersection of the axis values of 50 transports p. a. and 50 m in the distance intensity chart.
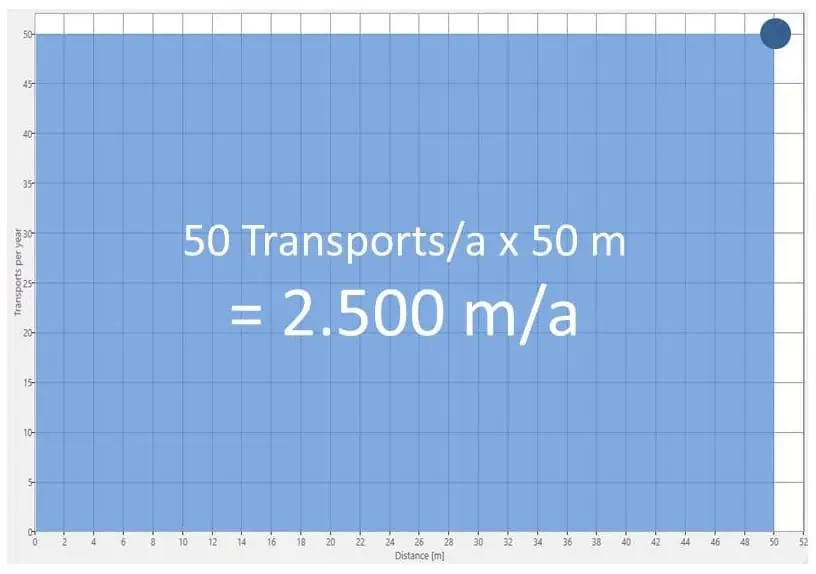
One point in the distance intensity chart, however, does not yet provide an expedient statement. In other words: All material flows of the layout under consideration are to be drawn wherever you wish to find optimization approaches. Commonly, the material flows interact with each other. If you reduce the length of a flow by changing the position of an area within the factory layout, it is usually also necessary to relocate a different area within the factory. As a result, other points in the distance intensity chart also move. If you wish to perform an optimization merely by way of this chart, you will quickly be stretched to your limits. Therefore, state-of-the-art factory planning software includes the distance intensity chart as an analytic tool, but links the chart with methods for layout optimization, transport intensity modeling functions, and the factory layout. As a result, this two-dimensional form of material flow analysis can be used effectively to illustrate potentials and ideas for optimization.
More about the material flow can also be found here in the video:
No problem, simply subscribe to our Blog-News!
