How to use the model catalog “Annotation” in visTABLE®?

Quite often, factory planning needs more than just the pure 3D model of a machine and the building. Symbols and texts help to communicate complex relationships in layout planning more quickly to those involved. They thus actively support visual 3d communication in the factory layout.
What is the name of the machine and the production area? Where is the operating point located? Where are the foundation anchors located? In visTABLE®touch there is the catalog “Annotation” for support with which you can easily visualize additional information in 2D and 3D. In the following some practical applications are presented.
The measuring point, universal coordinates for the equipment list
Similar to a target, it provides accurate position coordinates in x and y and can of course also include the height z. A practical use case is foundation anchors for the installation of a machine, as in the following picture:
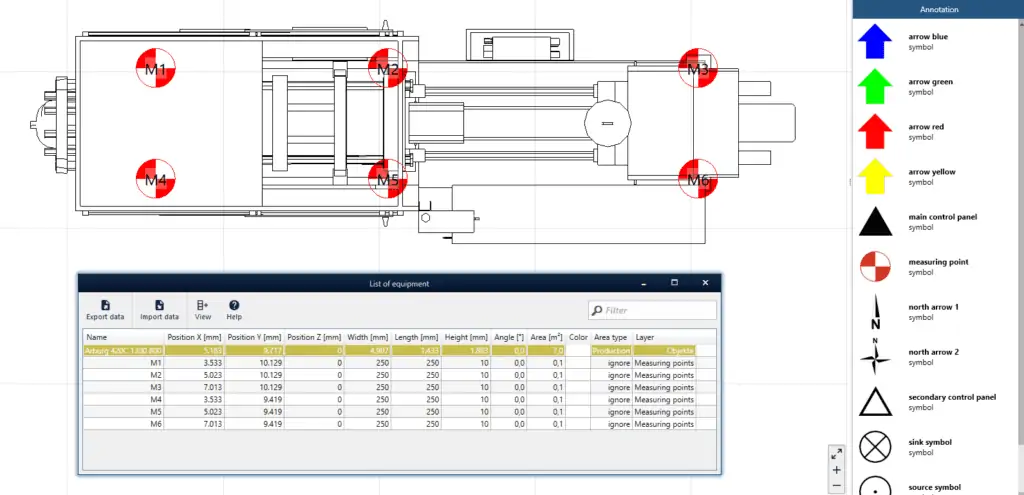
Visual communication in the 2D layout of a setup plan for an injection molding machine with measurement points of the foundation anchors.
The designation is arbitrary and can represent the numbering of the set-up points in the example. In this way, the coordinates are also automatically sorted accordingly in the equipment list. The list can then also be exported as an Excel spreadsheet to provide colleagues in the design. Measuring points are universally applicable and can of course serve for all possible coordinates, such as:
- Hall supports
- Media connections points
- Suction points
Measuring points can be easily shown and hidden, as they are automatically assigned to the “Measuring points” layer. They are also visible in the 3D view
Tip: You can achieve the contour display shown above in the 3D view by pressing the “o” key
Using text fields in combination with blocks and images for visual 3D communication
Text fields can be used very flexibly for any additional information, a few examples:
- 3D area signs in production
- notes on the current status in a layout area such as “being revised”
- technical notes on processes (temperature zones, for example)
The text field can be combined with a block in the “Block Layout” catalog to form a sign. Use it to form a module for your model library and reuse it in other layouts.
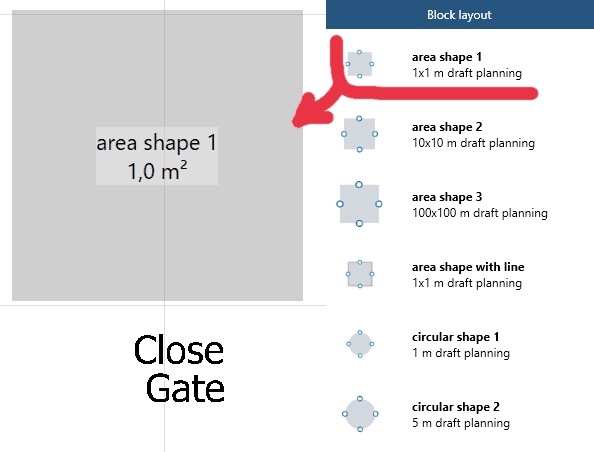
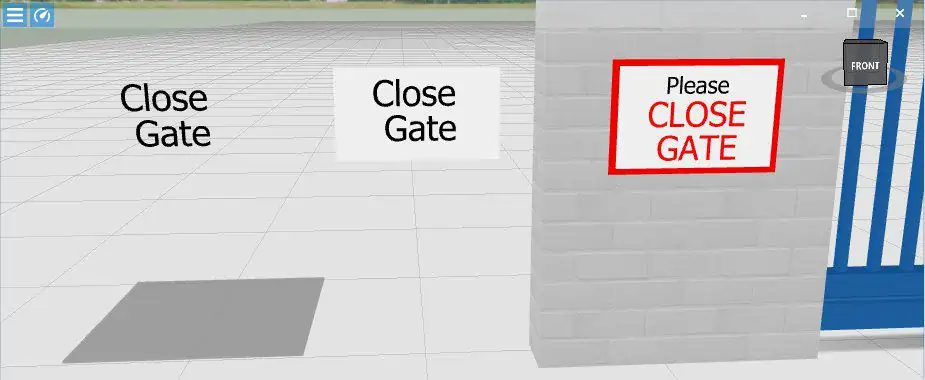
In the following picture you can see the two source objects on the left. Further to the right, a sign is created from the block area. This is done by adjusting the width, length and height and turning off the 3D property “Will be displayed transparent”. If several blocks, texts and colors are used, a wide variety of representations in 3D can be achieved in this way (see in the image on the right), which come closer to real signage.
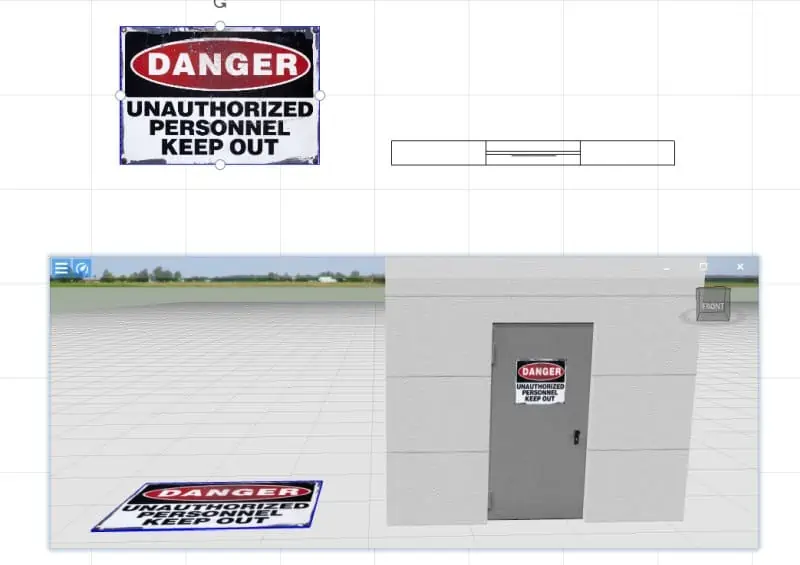
Tip: An extended possibility is also the use of imported image files (JPG, GIF, PNG, BMP) as flat blocks. To do this, simply swap the length and height values and you have an upright sign with the imported image on it. Disadvantage, you can only use it in the current layout and not save it as a module in the library. But on the other hand, complex and realistic representations in 2D and 3D can be realized using the image, as seen in the following example, ideal for visual 3D communication.
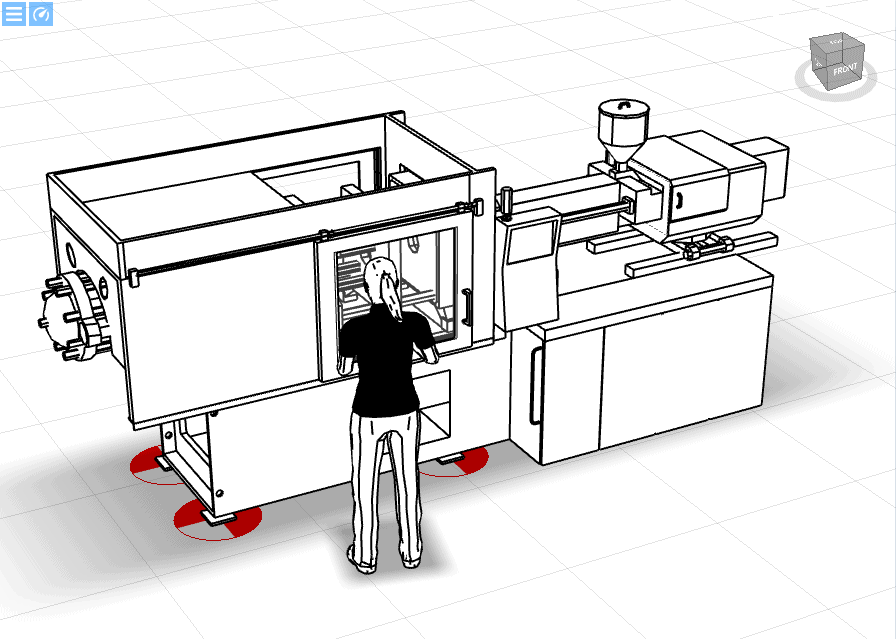
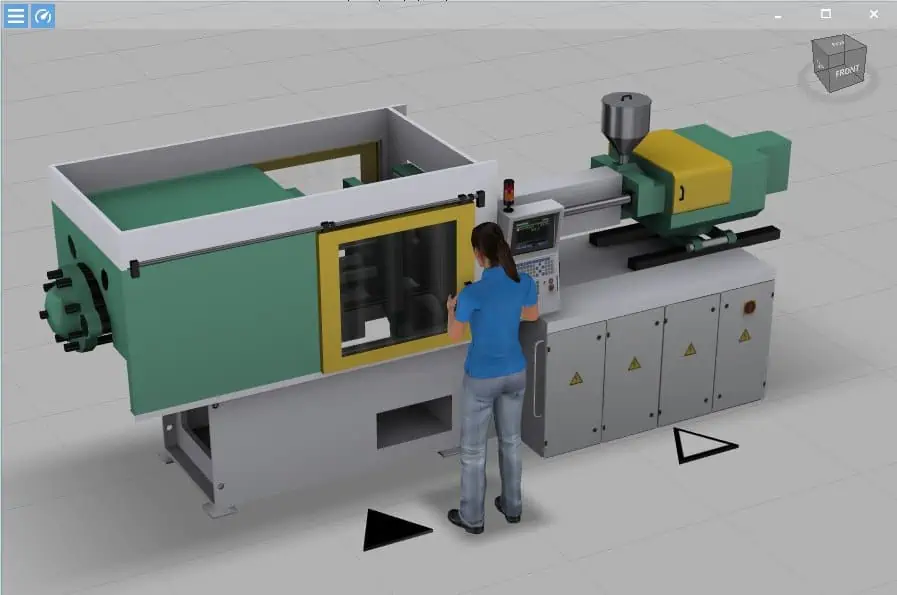
Visualize operating points on machines
Main operating points (filled triangle) and secondary operating points (unfilled triangle) can be clarified and better considered in the planning by using the symbols. In the example below, the main operating station is located at the control and door to the work area of the injection molding machine, and the secondary operating station is located at the material feed or the control boxes.
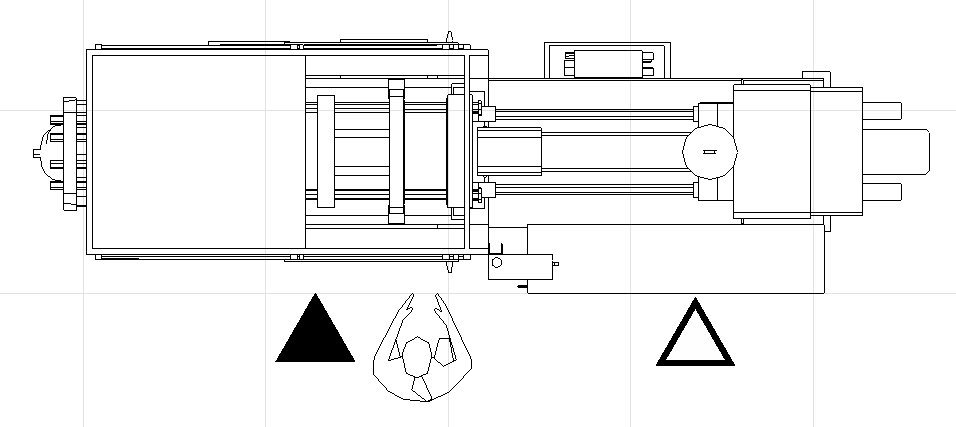
All symbols are automatically placed on the “Symbols” layer. This means that this additional information can be shown or hidden as required.
Control points are also visible in the 3D view of the factory model and thus promote visual 3D communication in the factory model.
In upcoming articles more catalogs with symbols and application possibilities will be presented. If you do not want to miss anything more, it is best to subscribe to our blog.
Further blog articles on the topic:
- 3D visualization as a thinking tool within the company
- What is the advantage of 3D factory layout planning
- Should you create a digital factory layout in 3D?
- Do I need 3D for layout planning?