In our last article we presented the basic procedure for a utility value analysis to evaluate layout variants. Here we will now look at the practical implementation of this method with the help of a Excel template. To apply and calculate the utility value analysis, you either create your own spreadsheet or download an existing Excel template from the Internet.

Costs and benefits of an own Excel template
Creating your own Excel template can easily take several hours and may require advanced knowledge of spreadsheets. A re-use by the creator himself or by other colleagues is rather seldom from experience and therefore the effort is driven again next time.
If one looks for appropriate templates on the Internet, there is a large selection, but not every Excel template can be used directly. Either a paid registration on an internet portal is necessary or the template simply does not meet the requirements of a utility value analysis for comparing layout variants.
At this point we would like to save you the time after searching for a suitable template. With our project experience, especially when comparing layout variants, we have created a template that you can use directly and free of charge. If required, you can adapt the template to your individual needs and applications and thus use it again and again. At the end of this article you will also find a video guide on how to use the Excel template.
Download the Excel template for the utility analysis
Note:
There may be compatibility problems with older versions of Microsoft Excel. It is recommended that you use Office 365 to use the template with the current version of Microsoft Excel.
The provided template for the utility analysis in Microsoft Excel can be found below and consists of five spreadsheets:
1. worksheet: INSTRUCTIONS
In this table sheet, the procedure for the benefit analysis is basically described in the recommended five steps. A button leads to each step, which guides the user to the respective spreadsheet. If there are problems or suggestions for improvement, you will also find the corresponding contact data in this table. Please also use the contact data to obtain the password for activating the worksheets for your own adaptations.
2. worksheet: START
Here you enter the information about the company, project, creator and the corresponding date in the header. In the two tables below you specify the evaluation criteria and define the variants to be compared. For a better understanding, it is recommended to support these with detailed descriptions.
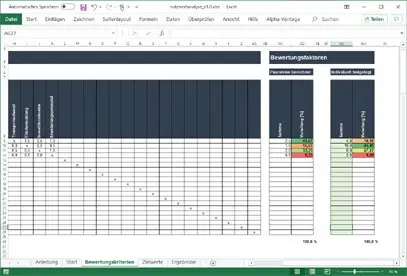
3. worksheet: EVALUATION CRITERIA
In the Evaluation Criteria worksheet, the evaluation criteria are compared in pairs. Depending on the number of evaluation criteria, there is a corresponding number of pairs to which a comparison value must be assigned. The evaluation matrix is filled automatically and the evaluation factors for weighting the criteria are obtained. In addition to the calculated factors, individual factors can be defined.
4. worksheet: TARGET VALUES
At this point, the target values to be defined are to be assigned to the specified evaluation scale (0 to 5). In the case of a cardinal evaluation, it is advisable to define over areas with less or greater than or equal to the target values. For an ordinal evaluation, for example, the classification can be from very good to very bad.
5. worksheet: RESULTS
The fifth and final spreadsheet presents the results. Before this, however, the absolute values of the respective variants for the evaluation criteria must be entered here and, after reading the corresponding target value in the previous table sheet, the target value must be taken from the scale (0-5). After selecting the evaluation factors (in pairs or individually) the utility values are determined and the variant with the highest utility value is marked.
With this Excel template you can experience for yourself how easy and quick it is to carry out such a utility value analysis. And the visTABLE®touch software provides you with at least two evaluation criteria for each layout comparison. These are the criterion transport costs and the criterion space utilisation. Try it out for yourself.
Video instructions for the Excel template utility analysis
By the way, don’t miss the next article in our three-part series on utility value analysis on 07.12.2020. Find out how utility analysis was used to select software for factory planning. Subscribe now