Flow charts and various process flow diagrams (PFD) fill countless pages in quality management manuals. All too often, they are smiled at as management wallpaper, and almost everyone knows that things work differently in practice anyway than they are theoretically painted on the brown paper in the production manager’s office. But where does the desire to create such manufacturing flow charts again and again come from? Do you end up with a benefit after all?
Let’s start with the question of motivation: What motivates someone to visualize a manufacturing process in a flow chart? The answer is almost always the same: It’s about understanding. What happens in what order? And with that, the benefit is clear: A flowchart clarifies temporal-logical relationships and thus creates a basic understanding of processes and workflows.
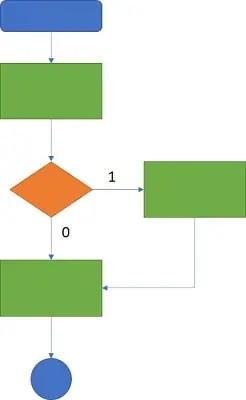
Well, let’s say: It could create a basic understanding. Because such a graphic is first of all free of semantics. That means only the creator of the flowchart will be able to interpret it correctly. What do the colors mean, for example? Or do the shapes have a certain meaning in the PFD?
Any flow chart requires interpretation
Therein is the greatest danger of flowcharts: They are apparently easy to understand. However, they can be interpreted completely differently by different persons as long as the symbols are not standardized or self-speaking. For this reason, we know many different types of flowcharts today, some of which are perceived as modeling languages. Here is an incomplete PFD list with reference to production process flows:
- Value Stream Mapping (VSM)
- Business Process Modeling (BPMN)
- Event-driven process chain
- Swimlane diagram
- Unified Modeling Language (UML)
- Activity flowchart (REFA)
- Quantity flow diagram (Sankey diagram)
- Spaghetti diagram (Lean Production)
- Priority graphs or network diagrams
It’s easy to lose interest in the topic, isn’t it? Now let’s go one step further. In addition to the above list, there are countless software tools, each of which has its own focus or, on the contrary, sees itself as a universal tool, e.g. Lucidchart. Only one thing is clear: There are countless ways to create such diagrams professionally. But does this solve the problem? No.
Because the fact remains: Every type of diagram requires interpretation. Interpretation requires knowledge. And knowledge requires learning. Or to put it another way: No flowchart contributes to understanding until those involved have learned to interpret the symbols used in it in a uniform manner.
Keep it simple
Understandable flowcharts are therefore characterized by a small, preferably self-referential symbol range. A small number of symbols logically reduces the range of applications. Therefore, specialized manufacturing flow charts are to be preferred to universal ones if they are to be easy to understand. And understanding was the motivation mentioned at the beginning to deal with process diagrams.
Perhaps this is why value stream sketching, extracted from the Toyota Production System by Rother and Shook around the turn of the millennium, gained such popularity in the practice of many manufacturing companies. This is because the value stream process maps are simple in that the symbols used and their arrangement are in many cases self-explanatory.
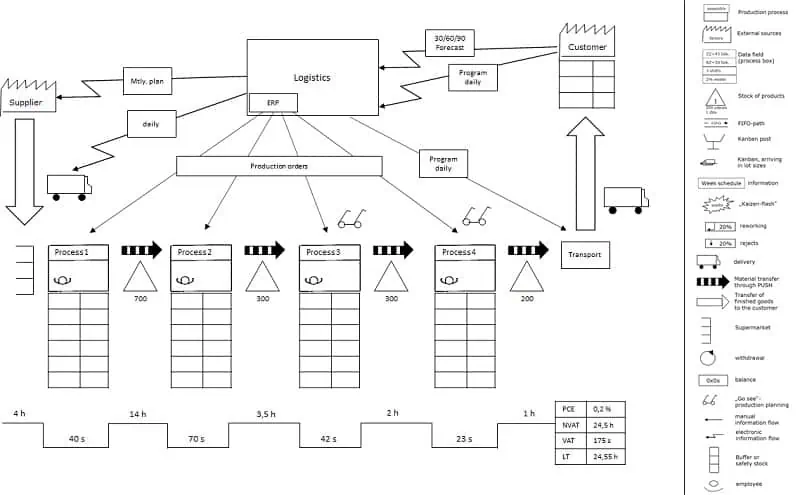
Another simplifying feature is the typical linearity of the value stream diagrams. Processes are run through them from left to right. There are no loops, as we typically find them in flowcharts.
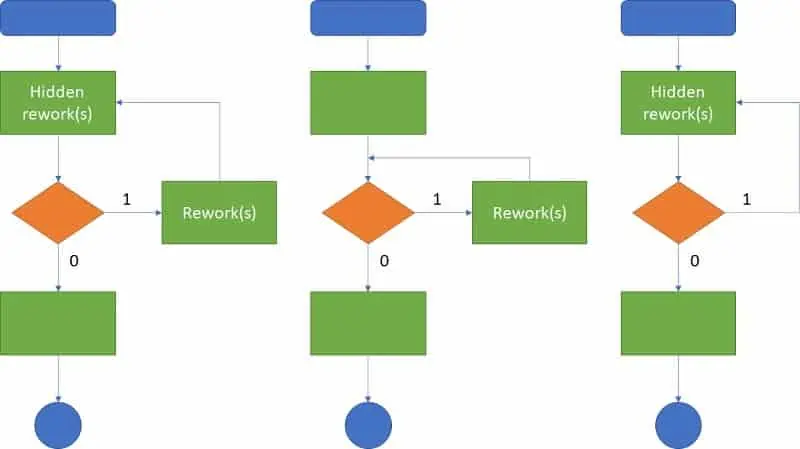
Necessary feedback steps can be understood quite intuitively in the form of a loop, which is why most flowcharts allow loops in some form. Without loops, however, no conditions need to be formulated at the branches or merges. This advantage should not be underestimated.
Few flowchart symbols and linearity
The value stream example shows that production processes can be modeled in a simple and understandable way. This may also be due to the flow principle, which the value stream design declares as its goal. Loops in the process lead to eddies and bring unrest. They create the need for buffers and control. So why should it be possible to model loops in a value stream chart simply? It is not purposeful and therefore not intended.
Especially since each loop can also be represented in a chain of similar steps, which illustrates their waste potential. Why run through an activity twice or three times? Why does it not succeed on the first run? Why rework?
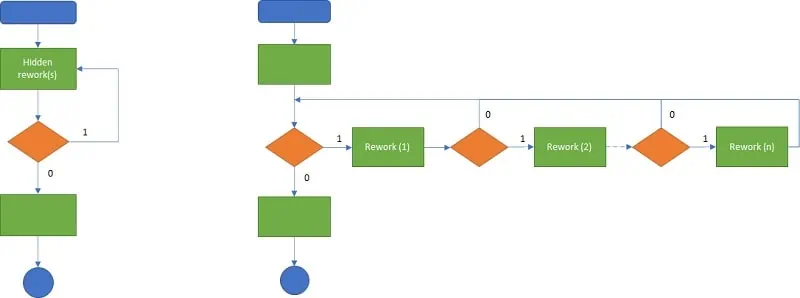
In value stream diagrams, therefore, we intentionally forgo opportunities. So we reduce complexity and thus keep the whole thing simple. To this end, this kind of PFD focuses on its purpose: It is about production processes that are as lean as possible. These can be realized with less control effort if processes follow the flow principle. This means that only a few symbols are required for value stream mapping, which are arranged linearly from left to right following the process flow.
However, one aspect is not modeled in the value stream: The logistics. This is because value stream representations focus on the throughput of quantity 1. This is modeled in the One-Piece-Flow, which allows consideration of lead time, Process Cycle Efficiency (PCE), and line balancing.
The design goal in value stream considerations is an ideal process, the target value stream. Logistics only emerges when the process has to be implemented in a production layout. Further parameters are necessary for the layout design (e.g. transport lengths, means of transport, path widths, and transport lot sizes). In the end, all this would overload the value stream chart document. It is therefore more than logical not to include this information in the process flow diagram.
What is the appropriate production flowchart?
To make manufacturing processes transparent and understandable, value stream mapping seems to be a good choice. It combines the representation of the sequence of activities (temporal-logical sequence of process steps) with the depiction of the associated material flow control (information flow) and important capacitive parameters (input and result quantities, circulating stocks, personnel strength, time requirements). It achieves its greatest effect as a flexibly manageable instrument in workshops to develop actual and target states of the production process. It is designed as an analog team tool and leaves its users relatively free.
Like many lean production templates, these characteristics are useful for team communication. However, they make digitization more difficult. This is because digital manufacturing flow charts must always be able to be processed unambiguously and without interpretation by a computer system. If value stream maps are to be made digitally usable, transformations are usually necessary to fill the scope for interpretation by enriching them with data. This results in even more comprehensive information, which can only be handled and understood through targeted filtering in a software interface.
This must be used as an advantage. In other words, one should not be tempted to demand the same scope of representation from a computer-readable production flowchart as from one recorded hand-drawn on paper. After all, everything that has been handed over to purposefully developed software can be safely lost sight of, because the software links the information appropriately in order to deliver predefined results.
This has another advantage. The effort required to enter the flowchart is reduced to a minimum; just a few gestures on the tablet PC are sufficient:
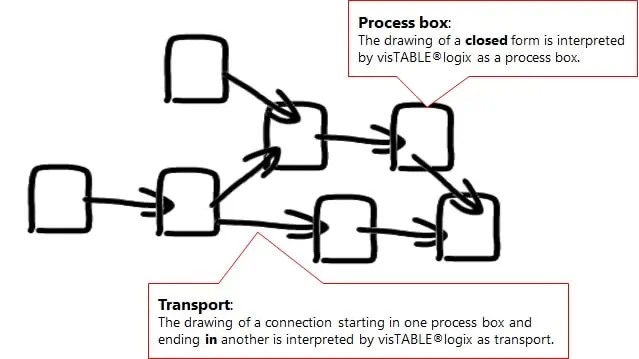
Of course, this requires that the used software is developed with the use case in mind. Software that serves to display all possible kinds of flowcharts can hardly fulfill such a requirement. Therefore, specialized software systems usually offer their own editors or interfaces for the transfer of process flow information. If the user interface graphically follows the value stream logic, exactly the same potential for comprehensibility is created that has made analog value stream mapping so successful.
Example of using a manufacturing flow chart
Just look at the following manufacturing flowchart for illustration. At first glance, you can see the process map for a product family “Shaft CTY” with an annual output of 200,000 pieces. Relevant capacitive key figures and the lead timeline are made permanently visible.
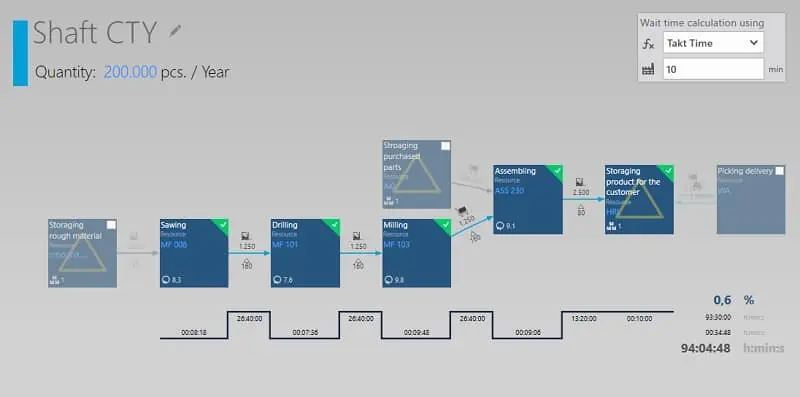
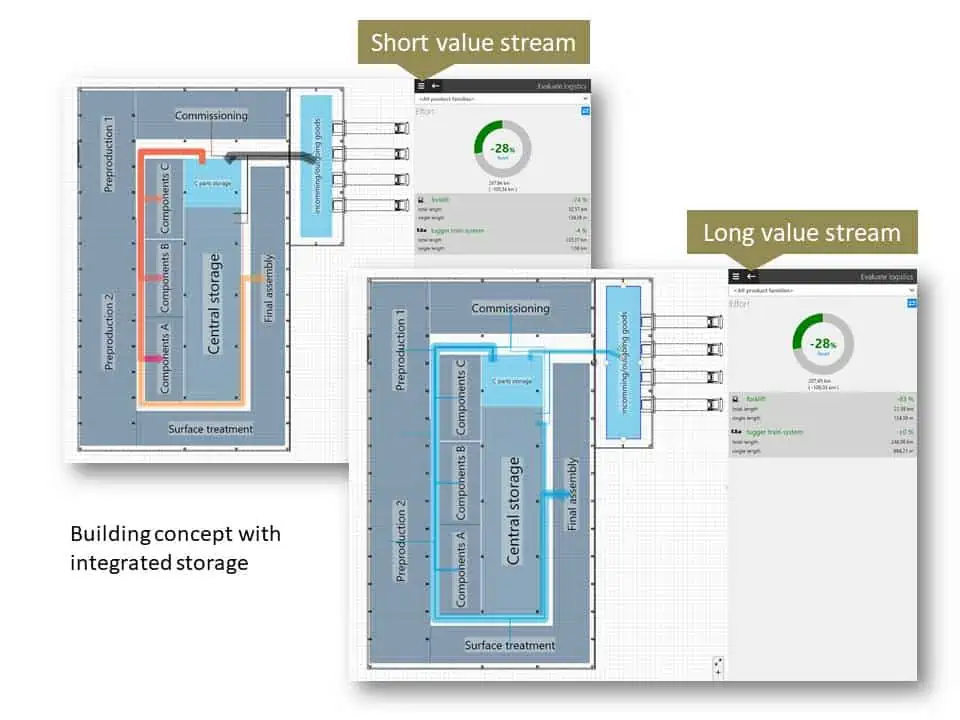
Behind the arrows are additional data that enrich the manufacturing flow chart with logistical information and link it to a digital plant layout. The plant layout, in turn, links the process flow diagrams of all other product families that are manufactured there. This creates a complete planning model for the production site, which provides key figures beyond the value stream. Planning decisions are much easier to make this way. The following blog post shows how it works.
Using process flow diagrams to optimize the production layout.
Please see the blog:
Related topics:
- How do factory layouts depend on the value stream?
- 5 ideas to make your Project presentation more successful
- Value Stream Mapping Software
No problem, simply subscribe to our Blog-News!
