Tutorials
Visualizing Material Flow in visTable®
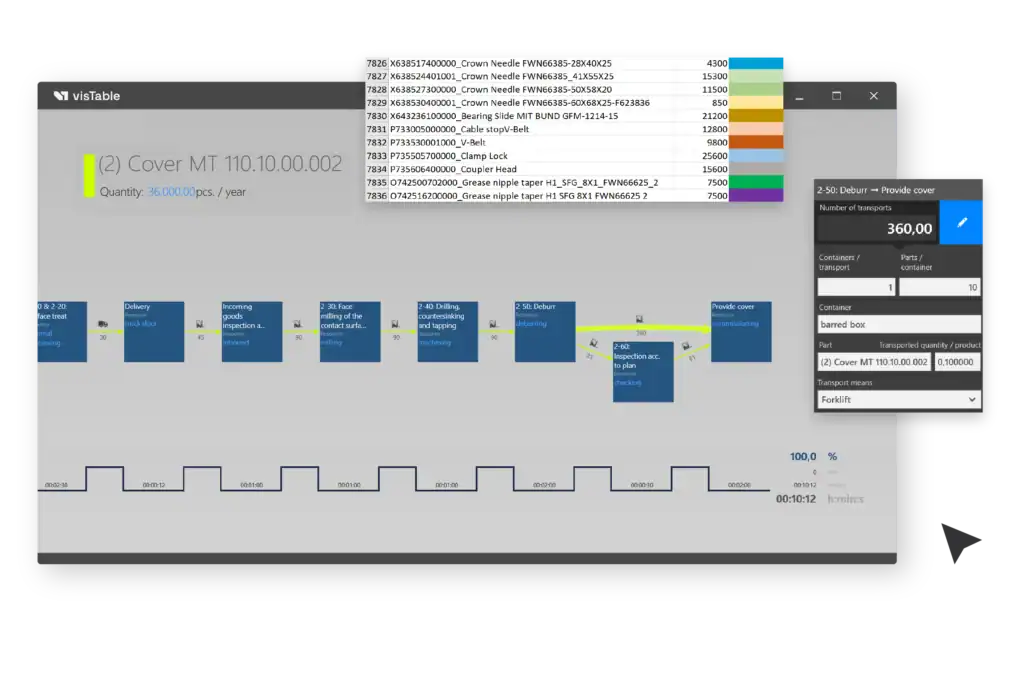
To generate meaningful material flow visualizations, simply define the transport intensities between your layout's production and storage resources. You can capture this data intuitively using visTable®logix or utilize standard tabular material flow formats. Thanks to a seamless Excel interface, importing and exporting all formats is effortless.
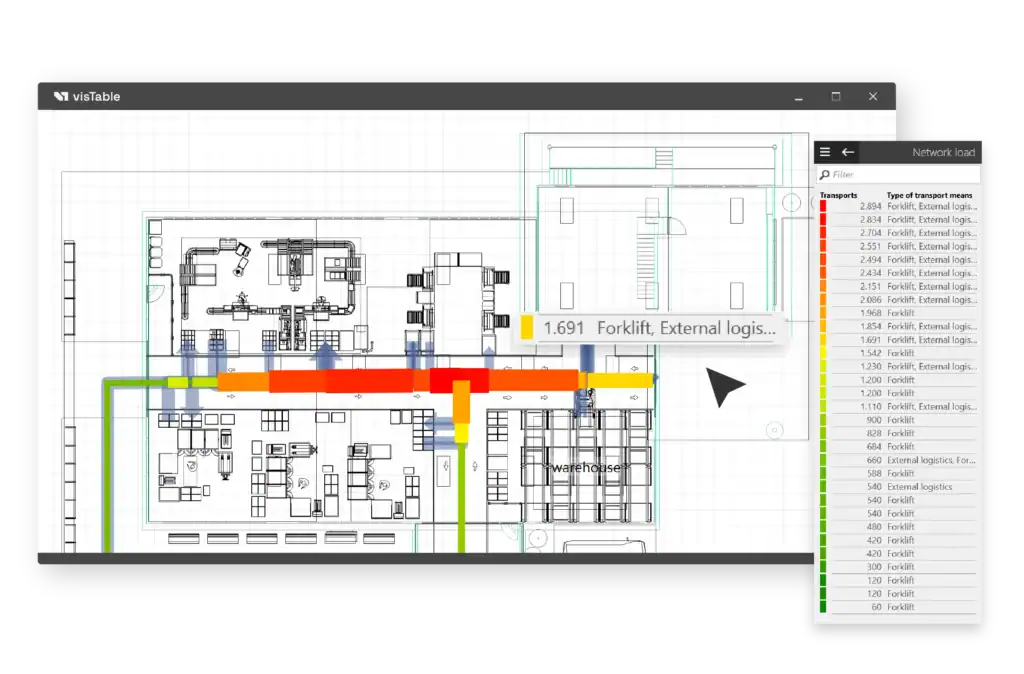
visTable® automatically calculates exact travel distances based on the physical placement of resources in your layout. By leveraging easy-to-create transport networks, you can guide material flows precisely along planned routes.
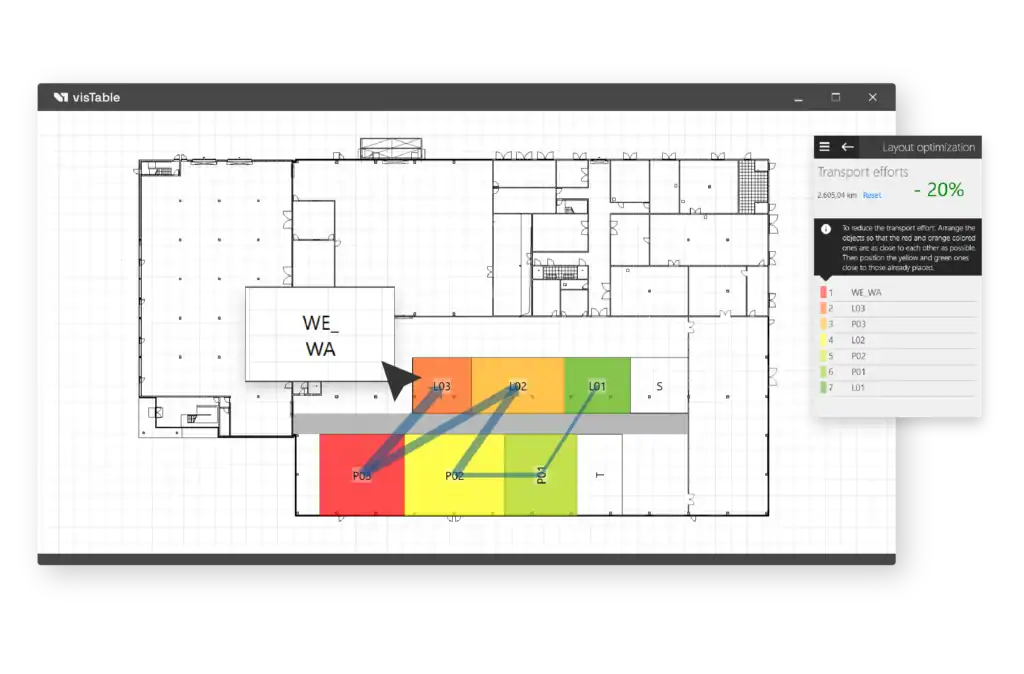
Insights at a glance: Variances in material flow intensity are instantly recognizable through dynamic arrow thicknesses. This visual data not only allows you to evaluate overall logistics effort but also serves as a powerful foundation for optimizing your entire resource layout.
Video Tutorials for Material Flow Visualization
Video Playlist
- Material Flow Management
- Microsoft® Excel® interfaces for material flow
- Create Transport Networks
- Set up transport networks for different types of logistics
- Tips for Transport Networks
- Evaluate logistics
- Network load
- D-I-Chart
Pracitcal Video Tutorials
Online Documentation
Looking for more details? The visTable® Online Help provides comprehensive documentation for every software feature, including overview diagrams, short videos, and step-by-step explanations. Each visTable® app also includes a dedicated getting started guide to help you learn the fundamentals quickly.