Tutorials
Design the Value Stream in visTable®
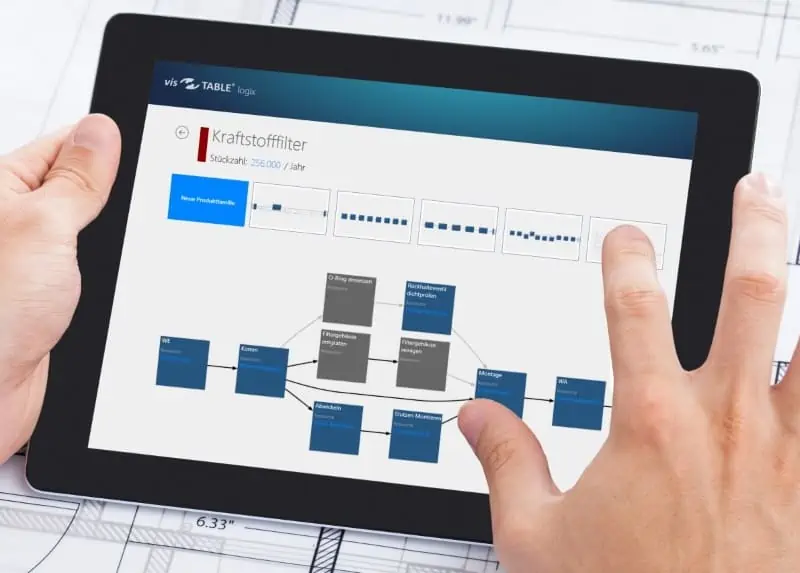
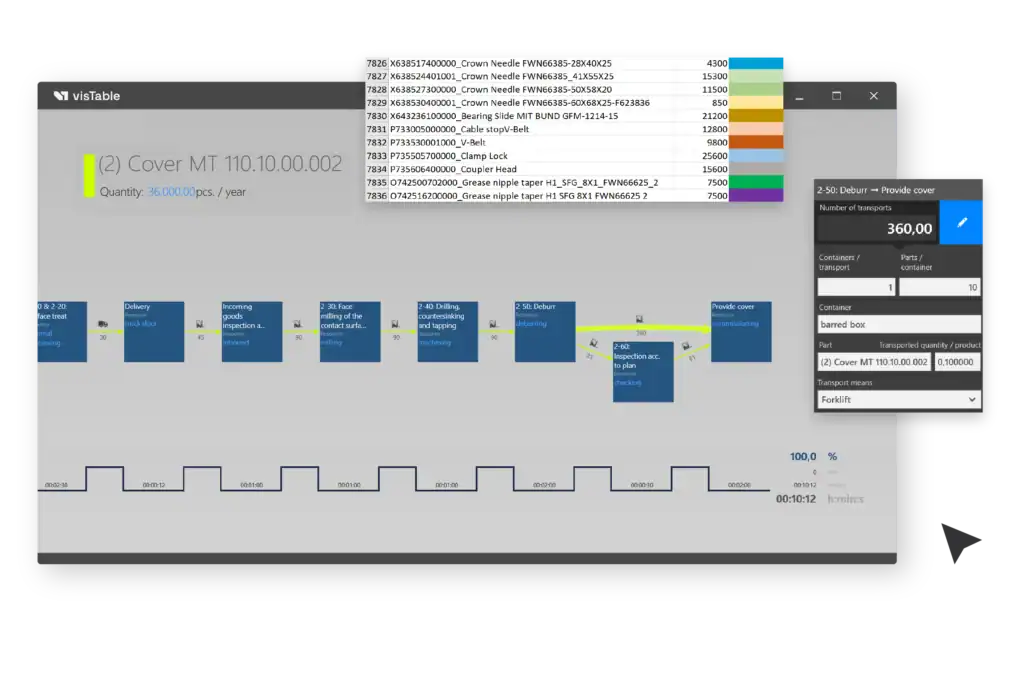
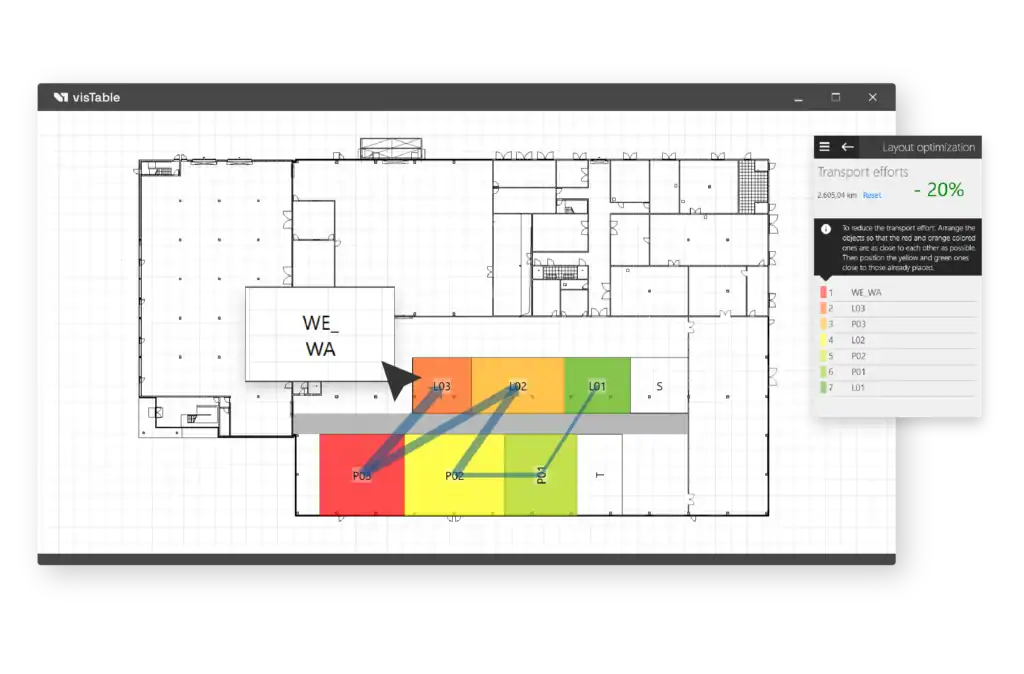
visTable® is designed to systematically plan and optimize production layouts, using value streams as your core data foundation. With visTable®logix you can map these value streams intuitively using simple gestures. Define product families (reference products) and seamlessly track material throughput during manufacturing. The result is a clear, visual graph mapping all processing, storage, and transportation operations.
By inputting relevant parameters such as batch sizes and transoport methods you recieve typical value stream key figures on the Timeline.
Online Documentation
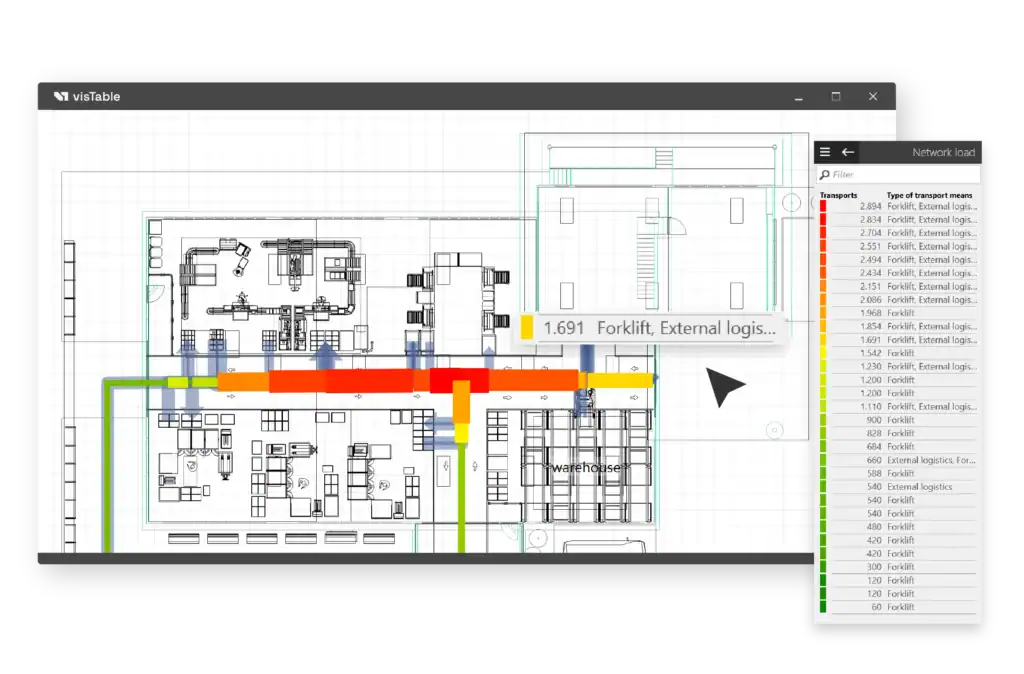
Looking for more details? The visTable® Online Help provides comprehensive documentation for every software feature, including overview diagrams, short videos, and step-by-step explanations. Each visTable® app also includes a dedicated getting started guide to help you learn the fundamentals quickly.