Visualize and optimize your material flow
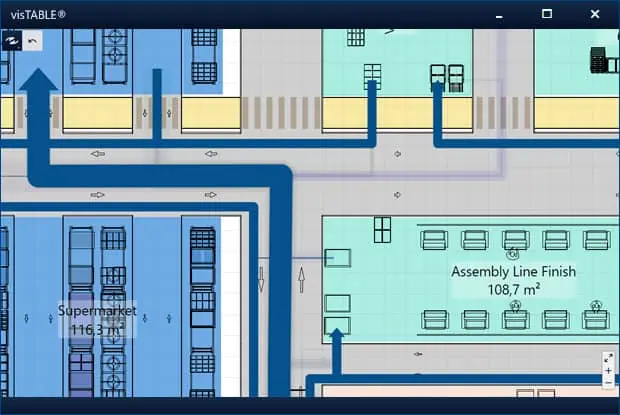
- Make transports, routes, and relocations visible
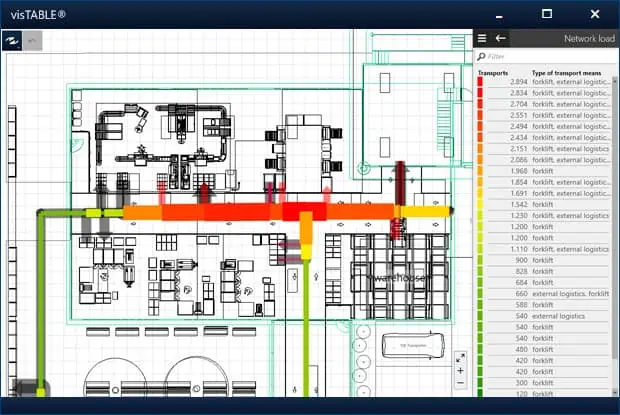
- Analyze and compare walking paths and material flows
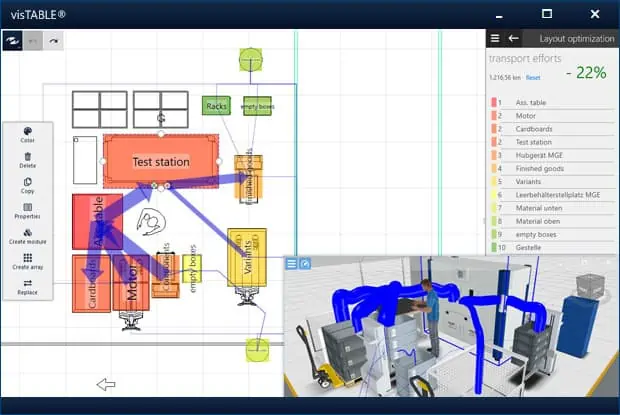
- Compare and optimize scenarios
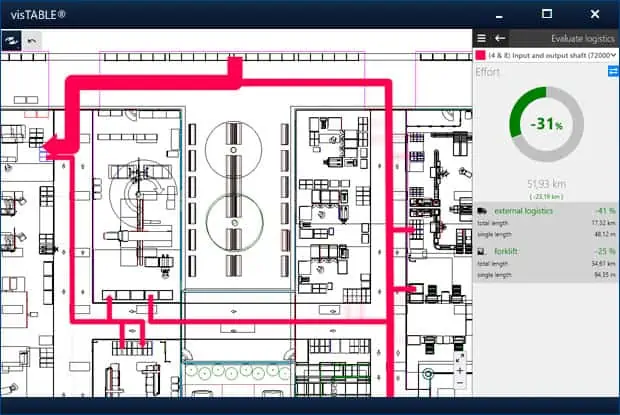
- Transparency through key metrics and charts
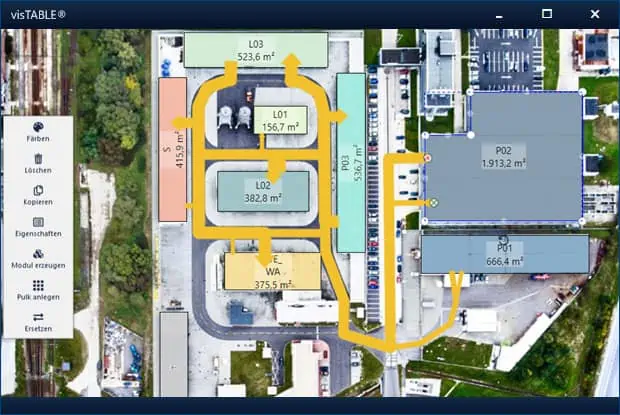
An efficient material flow determines the performance of both production and logistics. If transport routes are too long or spaces are used inefficiently, costs and lead times increase. With visTABLE®, you can design and analyze your material flow digitally, identify weak points instantly, and make improvements measurable. Its intuitive visualization and evaluation features – for example through interactive diagrams – guide users step by step through the process of material flow optimization.
System designs can be evaluated and optimized from multiple perspectives at the same time, taking into account all relevant interdependencies. This holistic approach leads to better management of raw materials, materials, and inventories – and enables transparent, flexible, and cost-efficient production planning.